Nelson Mandela Bay
As the showcase area, we put some additional effort into Nelson Mandela Bay.
Travel demand
We use the 2004 Travel Survey conducted by Nelson Mandela Bay that included a 24-hour diary component. Firstly, we parsed the survey data into a MATSim population using the class playground.southafrica.population.nmbmTravelSurvey.NmbmSurveyParser. Next we associated plans from the survey with each individual in the synthetic population.
Associating plans means that each person in the survey was first given a demographic signature. This was done using four characteristics:
- Employment status, either
WorkingorNonworking. - Age, grouped into the classes
Infant(< 6 years);Child(6 - 12 years);Youngadult (13 - 23 years);EarlyCareer(24 - 45 years);LateCareer(46 - 68 years); andRetired(> 68 years). - Household size, grouped into classes
Small(< 3 members);Medium(3 - 10 members); orLarge(> 10 members). - Income, grouped into classes
Poor,LowMiddle,EmergingMiddle,Middle,UpperMiddle,EmergingAffluent, andAffluent. These classes were inspired by the University of South Africa's Bureau of Market Research's Research Report 429 titled 'Income and expenditure of households in South Africa, 2011'.
For each individual in the synthetic population we determined the demographic signature, and shortlisted the observed survey plans from the 20 individuals with home locations closest (geographically) to the home location of the synthetic person. From the shortlist we randomly picked one plan and assigned it to the synthetic person. The activities in the travel demand include:
h- home-based primary activities;w- primary work activities;e1- attending school, be it pre-primary, primary or secondary;e2- attending some tertiary or adult-based education institution;e3- the activity of dropping or picking someone up from an educational institution. This is a quite prevalent in South Africa where many kids are dropped at school by one of the parents using a private car;s- shopping;l- leisure; ando- all other activity types.
All the activities are connected with one another with one of the following modes:
car- private car as driver;ride- private car as passenger;taxi- minibus taxi (paratransit);bus- formal bus (Algoa Bus);train- the MetroRail service running a single line between Port Elizabeth and Uitenhage;walk- as the mode between two activities. This does not account for the walking portion to get access to public transport;other- all other modes like cycling, motorcycling, and animal-drawn cart.
Activity locations
The households in each of the areas have a home location that is randomly distributed within the subplace. From a transport planning perspective this is already quite good and disaggregate. In reality, however, households don't live in zones, but rather buildings. So, to make the Nelson Mandela Bay population a bit more realistic, we decided to assign each activity a real location, taking the land use into account. For this, we partnered with GeoTerraImage (GTI), a privately owned company providing geographical information services and products. More specifically, we used the Building based land-use data product containing point features, each having a land use code. There are 16 main classes, many of which have secondary and even tertiary land use codes. We filtered the points, estimating which activity types might be conducted at those land use classifications. Here are some additional notes:
Home- the residential buildings were further classified into aFormalHouse,TraditionalDwelling,Cluster,Informalhousing orOther. This was to take advantage of the available main dwelling type data in the Census 2011 data, and as an attempt to address the economic inequality prevalent in South Africa.Education- the facilities where education occurs were further split intoPrePrimary,Primary,Secondary, andTertiaryeducation buildings, and the age of the person was used to estimate the correct, or at least most likely, building type.Work- the places of work included nearly all buildings types: agriculture, forestry, conservation, mining, transport, utilities and infrastructure, residential as well (domestic workers and gardeners make up a sizeable portion of the job market), community service, healthcare, education, commercial, industrial, recreation and leisure, tourism, and other institutions. The latter includes incomplete building sites.Shopping- the location of shopping activities were limited to buildings classified as commercial.Leisure- here we included all commercial buildings (shopping malls account for the majority of retail space, but also includes leisure amenities), recreation and leisure, and tourism buildings.Other- for the remaining activity types, we considered agriculture, community service, healthcare, educational facilities categorised as "other", commercial, institutions, and buildings classified as "other".
We start with an activity location that was randomly distributed in the subplace. To assign it to an actual building, we look again at the 20 closest buildings that can accommodate that particular activity type. From this shortlist, we randomly pick one. In the case of residential buildings, with the exception of clusters, we remove the building as we assume that only a single household can be allocated to any one building.
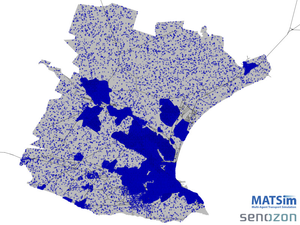
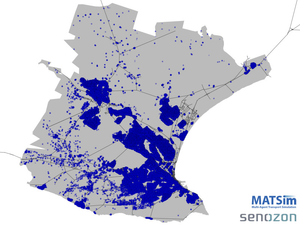
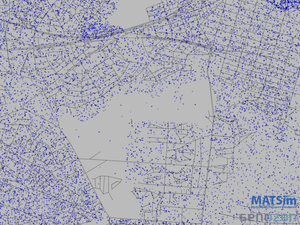
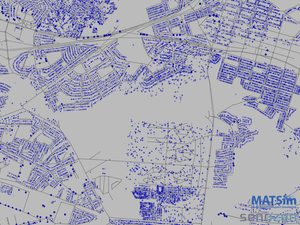
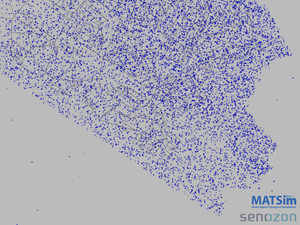
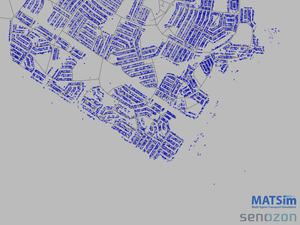
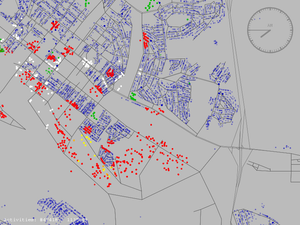
The impact of assigning activities to actual buildings is quite astonishing. Consider below the contrast between households with randomly distributed activity locations (left), and the same households with activities associated with GTI buildings.
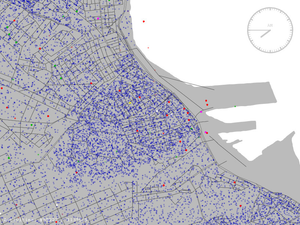
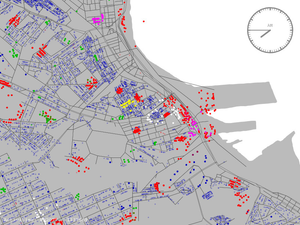
In the above figures, we show the night time population, that is when the majority of agents are home. Below is an example of the activity distribution during the mornings.
Public transport
Two forms of public transport was modelled during the course of this project, both formal (bus and passenger rail) and informal paratransit, or better known in South Africa as minibus taxis.
Formal transit
The first step was to capture the routes and timetables of the two formal modes, namely passenger rail and bus. Unfortunately authorities in South Africa has not yet started publishing their data in a easy-to-use standard. We converted the rail schedules from the Metrorail Excel Spreadsheets and PDF documents into the General Transit Feed Specification (GTFS). Although unofficial, it has been released on the GTFS Data Exchange (not maintained currently). We also partnered with Algoa Bus Company and got an early dump of their Swedish Rebus system. Although we were allowed to use the GTFS conversion we created, we are not at liberty to publish it. The Algoa Bus routes have anyway undergone major restructuring over the past two years. We extensively used the GTFS2TransitSchedule contribution within MATSim to prepare the necessary data formats.
Paratransit
A really neat and novel slant to this project was the ability to, for the first time to our knowledge, be able to model the dynamics of the paratransit mode often found in developing countries. This first started with the Masters project of Daniel Röder (see working paper 13-11) who spent a few months in South Africa, and followed by his supervisor, Andreas Neumann, who successfully defended his PhD in 2014 with a thesis title "A paratransit-inspired evolutionary process for public transit network design" (link to follow). A working paper by Neumann et al. (2014) is forthcoming in the Journal of Transport and Landuse.
The resulting case study
(To be uploaded...)
References
Neumann, A. (2014). A paratransit-inspired evolutionary process for public transit network design. PhD thesis, FG Verkehrssystemplanung und Verkehrstelematik, Technical University of Berlin.
Neumann, A., Röder, D., and Joubert, J. W. (2014). Towards a simulation of minibuses in South Africa. Journal of Transport and Landuse, forthcoming.
Röder, D. (2013). Simulation of south african minibux taxis. Master’s thesis, FG Verkehrssystemplanung und Verkehrstelematik, Technical University of Berlin.
